KPI Snapshot
Reporting that Matters
Proper reporting enables businesses to make better and faster decisions. It is common to utilize several vendors to manage different aspects of the business which can be time consuming. This often creates challenges when identifying potential marketing or process improvements. This is where proper reporting can save a lot of time, digging, asking, wondering and headaches.
There are a few core elements for reports to be useful (and not a bunch of noise).
- Frequent and Recent Data
It’s important to look at current information in order to make quick and effective decisions.
- Catering to Business Needs
In some cases, highly detailed reports can be a hindrance. It’s important to look at both financial and non-financial data in order to identify trends and potential areas of opportunity.
Taking time to analyze granular information may take away from actual business development especially when the subject matter is not the businesses’ speciality or core focus. Snapshot reporting provides businesses enough information to feel confident they are moving in the right direction or a meaningful starting point to begin digging deeper.
- Creating Team Engagement
Digestible reports assist teams/departments to work towards a common goal and provide a tool to measure performance. This can create collaborative teamwork and engagement.
The KPI Snapshot Report
KUKUI is excited to announce a new reporting feature! These elements along with KUKUI’s expertise in the auto repair and service industry went into building this feature.
This report is a compliment to all of the products and services already available. The KPI Snapshot is a monthly overview of key performance indicators with KUKUI products and features delivered in a concise report. We built this feature with the intention of displaying trends, historical and recent performance comparison, and to provide a snapshot summary of your monthly website and ad performance.
The KPI Snapshot is organized in different summary sections in order to present data in a digestible manner and for shops to better focus on the items important to them.
Let’s get into the details…
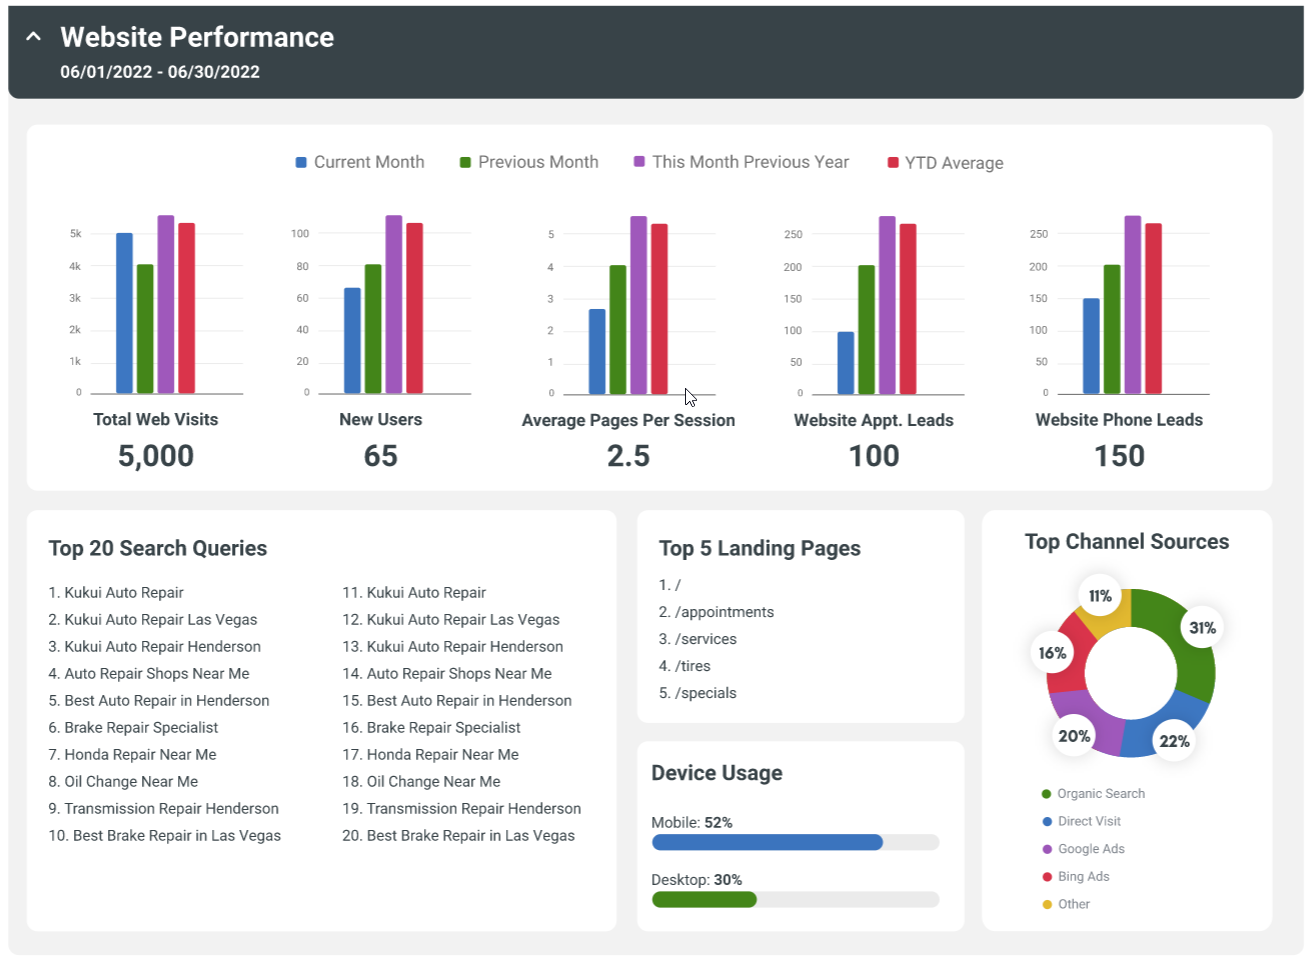
Website Performance
The website performance section provides current and historical data on website traffic, behavior and lead generation. This section presents data provided by Google Analytics and Google Search Console along with KUKUI lead tracking tools.
Did you recently make changes or additions to your website or SEO efforts? This section allows you to measure the effects of those changes at a high level.
One handy feature in this section are the various time periods presented for comparison. Easily compare current performance to the previous month, YTD average or the same month last year. This industry surely has seasonal trends but recent years have come with changes and challenges and we recognize that sometimes 12 months ago may not be a relevant time frame for comparison for every shop.
SEO is a hot topic and often misunderstood. The ultimate goal of SEO is to increase website traffic, feel confident that your website is being engaged with on Google and ultimately generating more leads and more revenue. If you are focused on SEO performance below are some items that may be helpful to you, all included in the KPI Snapshot:
- Total Web Visits
- New Users
- Search Queries
- Channel Sources
- Appointment & Phone Leads
- Matched Revenue for Google Organic leads
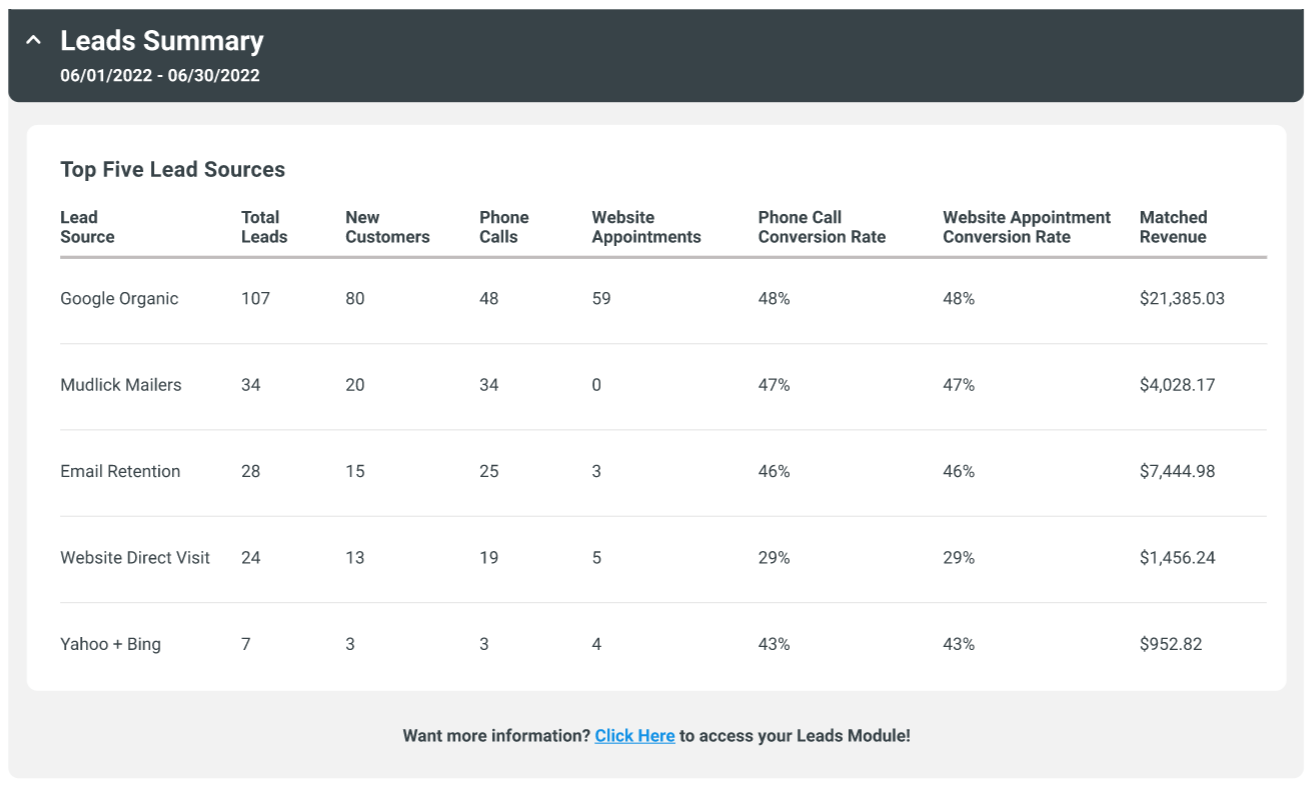
Top Lead Sources
The lead summary section allows you to analyze marketing channels that deliver the most leads. Here you can also view the conversion rates for different lead types: phone lead vs website appointment leads and see the matched revenue generated from your top lead sources. This section should help shops identify areas of success and areas of opportunity when it comes to marketing channels and the process of converting leads.
If you are looking to measure the ROI of your website, take a look at the website related lead sources in the Lead Summary section: Google Organic, Yahoo + Bing, Website - Direct Visit & Website - Unknown Source. These leads originated from the website.
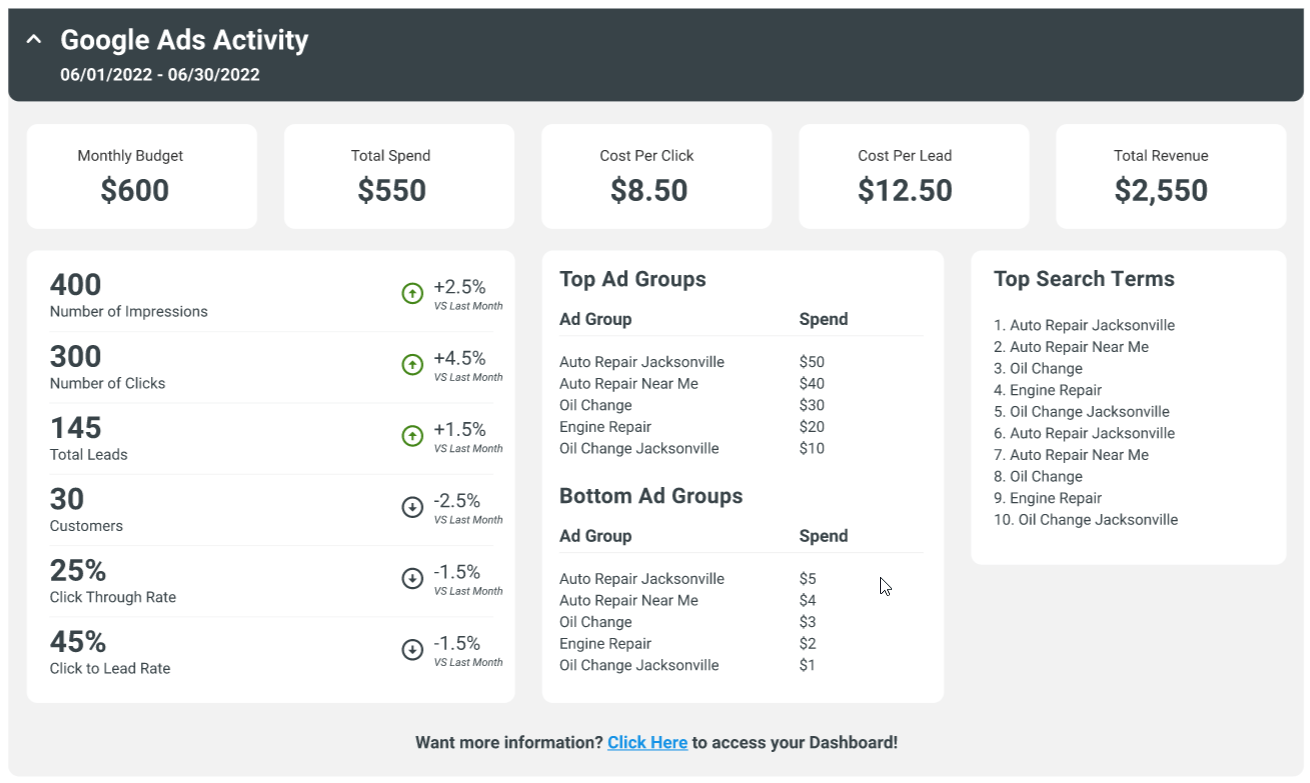
Google & Microsoft Ads Performance
Do you advertise with Google Ads or Microsoft Ads?
If your answer is yes then this report will be an excellent starting point for monitoring performance and following up on any recent changes made. In the case of paid ads, it is common for shops to make frequent adjustments which is why we present performance compared to the previous month.
In this section you can discover important information pertaining to your paid ads like:
- Monthly ROI
- Top Search Terms
- Ads Groups with the most/least engagement
- PPC related KPI's such as: Click Rate, Lead Rate, Cost per Lead and more!
Did you increase your budget? Begin advertising for a new vehicle or service? With the data in this section you won't have to wait long to see the effects of those changes.
The KPI Snapshot Report is available now and each month’s report is uploaded on the 2nd of the following month. If you view the report after the 2nd of the month be sure to click the refresh button to see up-to-date data. Not a member of the KUKUI family yet? Click here to request more information about some of our offerings and request a demo today!
Categories
Archives